 Mike Mackrory
Legacy Application Modernization: Key Steps, Benefits & Best Practices
This blog post was co-authored with Riaz Merchant, President and CEO at Mertech. In the fast-paced software world, 'legacy' often signals a warning.


Migrate and run DataFlex applications with Oracle, MS SQL Server, PostgreSQL, MySQL & MariaDB.
Stuck in Crystal XI? Upgrade and use the latest versions of Crystal Reports with DataFlex applications.
Convert from Btrieve / P.SQL / Actian transactional engines to Oracle, MS SQL Server, and PostgreSQL

Quickly build multi-protocol web services with the same API. Supports JSON-RPC, REST, SOAP, Thrift, and gRPC.


Thriftly 2.2 was released in October of 2018, and included three new and improved features. New licensing allows your Thriftly Developer trial to be free forever, and the addition of gRPC support offers customers an additional high-performing transport and protocol option. The third new feature is the addition of an API metrics endpoint to Thriftly APIs, and it’s this feature that I’m excited to share and demonstrate in this article.
I’ll start by talking about why API metrics are important and why you should be monitoring them, and then I’ll show you how easy it is to access the metrics endpoint and display the metrics using the Prometheus platform.
I’ll then take it a step further and integrate our metrics into a Grafana dashboard, and discuss how we can automate monitoring so you can focus on new features for your product and let Grafana handle the tedious task of monitoring.
Once your API is deployed and running, it’s vitally important that you monitor it to ensure that it is operating as expected. We need to know when our API is available and when it isn’t available. We also need to know when issues begin to manifest, whether they are due to a problem within our application or external entities. All of this is important for ensuring the best experience for our customers.
An effective monitoring solution consists of two parts. The first is ensuring that you’re collecting the right metrics and that you understand what they mean for your application. The second is an automated system to keep track of metrics and alert you when errors or anomalies occur.
For this example, I’ve got the Sample Java App running on my local machine on port 60750. Since I’m using version 2.2 of the Thriftly server, the metrics are already being gathered or scraped and made available on port 9290. The first thing we need to do is get Prometheus downloaded and running so it can pull this data into its database.
Download Prometheus (The Prometheus monitoring system and time series database) from https://prometheus.io/download/. I’ll be using version 2.6.1 for this example. You’ll need to extract the package, and then configure it to access the metrics endpoint.
Once you’ve extracted the files, locate a YAML file called prometheus.yml. Open the file to edit it, and scroll to the bottom section, labeled static_configs :
The Prometheus server uses port 9090, and it is listed as the first target. Remembering that spacing is critical in YAML files, add the metrics endpoint as a target below the Prometheus target.
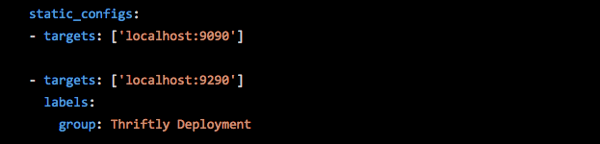 Fig. 1: Configuring Prometheus to access the Thriftly metrics endpoint
Make sure you save the configuration file. Now all you need to do is start the Prometheus service, which is as simple as clicking on the prometheus.exe executable. Once the service has started, you’ll see the message “Server is ready to receive web requests.” Now you can navigate to http://localhost:9090/targets, and you can verify that your metrics endpoint is connected and healthy.
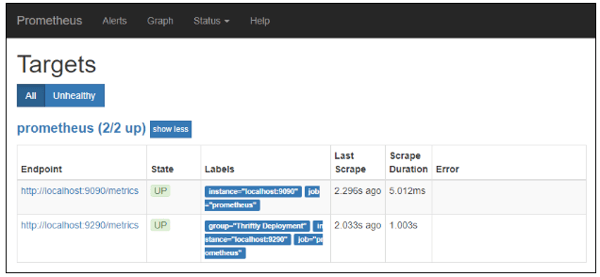 Fig. 2: Prometheus is running and attached to the metrics endpoint
Prometheus is a time series database and monitoring interface. Time series data is collected in regular intervals for specified values, so you can observe trends and see the history for each metric. You can view different metrics from the Graph tab of Prometheus. Depending on your Thriftly license, you will have access to some or all of the following metrics:
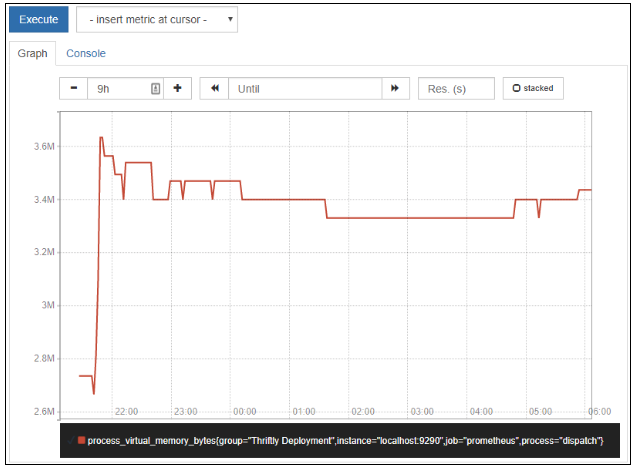
Fig. 3: Viewing virtual memory usage for nine hours with Prometheus
For this demo, we’re using Prometheus as a transitional step between our Thriftly server and Grafana, but if you would like to know more about working with metrics within Prometheus, the Query Documentation for Prometheus is very thorough.
The Prometheus dashboard and graphs are functional, but not visually appealing. We’re going to use Grafana with a Prometheus integration to create a more presentable dashboard, and also create alerts to let us know if problems occur with our application.
You can download the latest version of Grafana from the Grafana website. After you’ve downloaded and extracted the Grafana package, navigate to the /bin folder and click on the grafana-server executable.
The default credentials for a new installation are:
Username: admin
Password: admin
You’ll be prompted to change the admin password after your first successful login. After you log in, you’ll be taken to the home page.
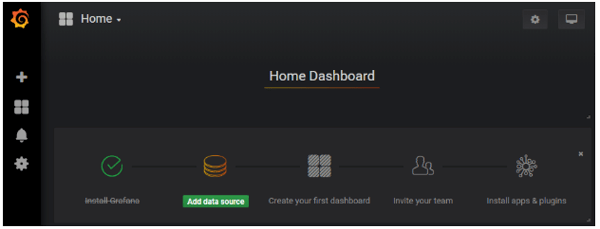 Fig. 4: Grafana home page
Click on the Add data source link, and then select Prometheus from the available data sources.
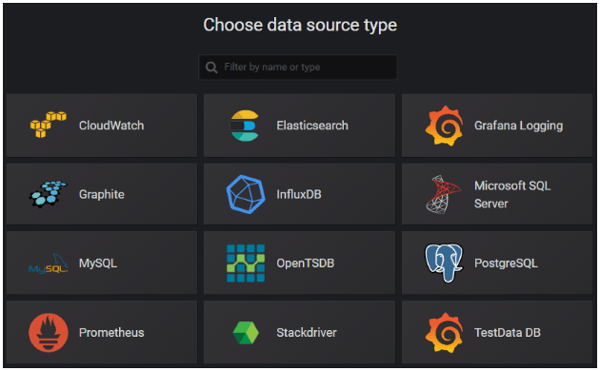 Fig. 5: Grafana data sources
If you install Prometheus with the default settings, the only items you’ll need on the next page are to ensure that Default is checked and that the URL is set to http://localhost:9090. If you customized your Prometheus application, options exist for authentication methods and data collection frequency.
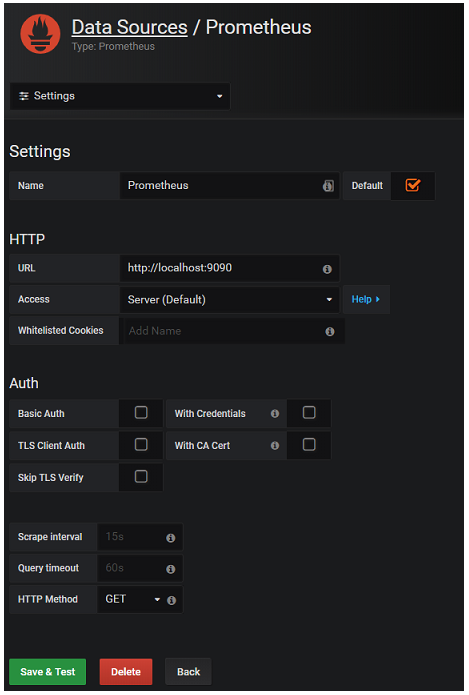 Fig. 6: Configuring the Prometheus data source
Finally, click on Save & Test to complete the configuration process. Assuming everything works as expected, you should see a confirmation like the one below.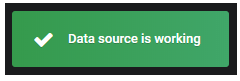
Finally, let’s add our metrics to a dashboard and add a condition which indicates a metric level which might be cause for alarm.
Click on the large Plus sign on the left-hand navigation panel, and choose to Create a new Dashboard. Let's start by adding a new Graph to our dashboard.
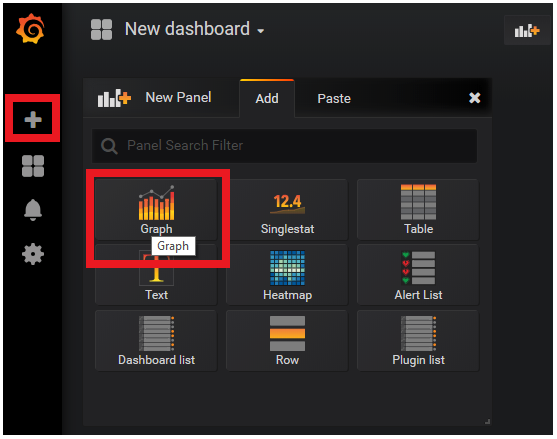 Fig. 7 Adding a new dashboard with a graph panel
Click on the Panel Title and choose Edit from the drop-down menu. Make the following updates:
Finally, click on the Save icon in the top navigation bar. You’ll be prompted to enter a name for your new dashboard. I chose Demo Dashboard and clicked on Save.
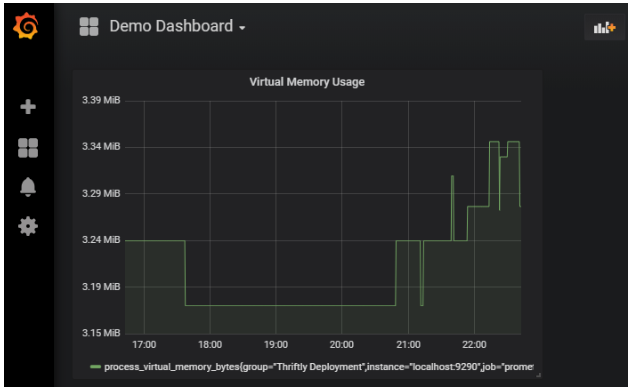
Fig. 8: Viewing Virtual Memory Usage metrics in Grafana
We’re viewing the same data here as we saw in the Prometheus application, but the time is localized, and the visual display is far more appealing. We can also add additional panels to compare data or view other metrics on the same dashboard.
For our final step, we’re going to add an Alert. Click on the panel title again, and choose Edit. On the Alert tab, click on the Create Alert button.
On the Alert Config panel, select a condition that indicates cause for concern. I set the condition to an average of 3,540,000 bytes to demonstrate this feature. You’ll notice the broken heart icon moves up and down the graph based on the value, giving a visual indicator of where the alert condition occurs.
On the Notification section, you can enter an email address and an alert message.
Finally, if you return to the Alert Config section, you can click on the Test Rule button. A data display below the button indicates whether the alert threshold has been breached.
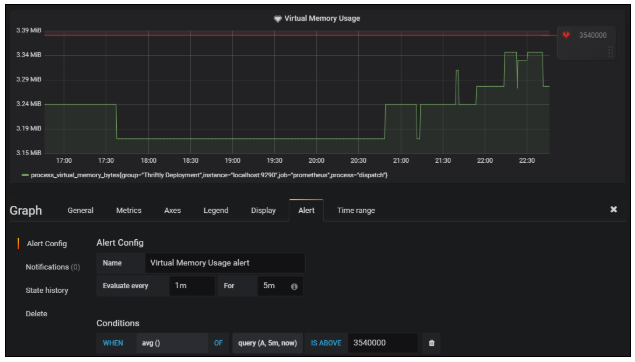
Fig. 9: Graph with alert condition set
We combined several technologies as part of this demo. Each has more options and functionality than could be discussed in a single post. If you would like to know more about each, the links below provide a good starting point:

This blog post was co-authored with Riaz Merchant, President and CEO at Mertech. In the fast-paced software world, 'legacy' often signals a warning.

This post was co-authored with Riaz Merchant, President/CEO at Mertech Data Systems, Inc.

Shifting from your traditional legacy systems to the Cloud can be a game changer, as the benefits of cloud migration are numerous. Cloud computing...